What is the Cook PVI℠?
What do the scores mean?
How is the Cook PVI different from race ratings?
Historical Cook PVI℠ Values Now Available
2022 Cook PVI: 25th Anniversary Edition
The Cook Partisan Voting Index (Cook PVI℠) Explained
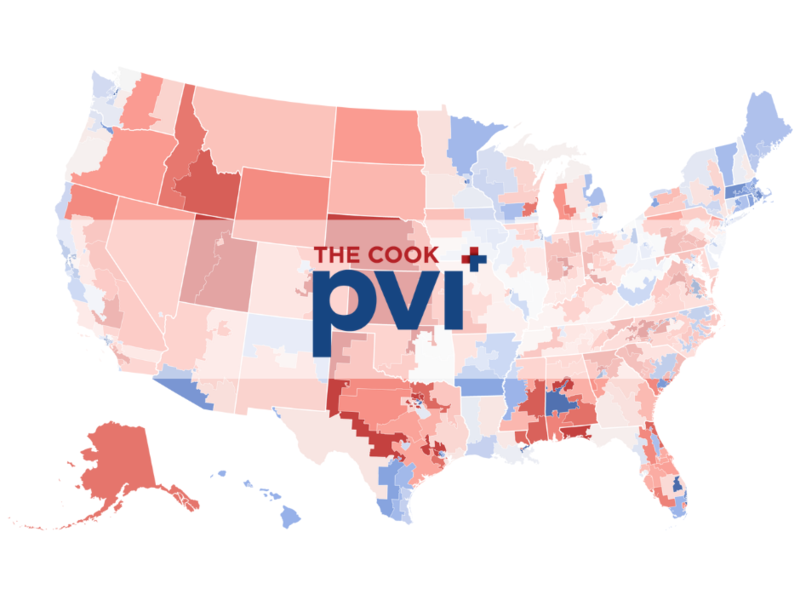
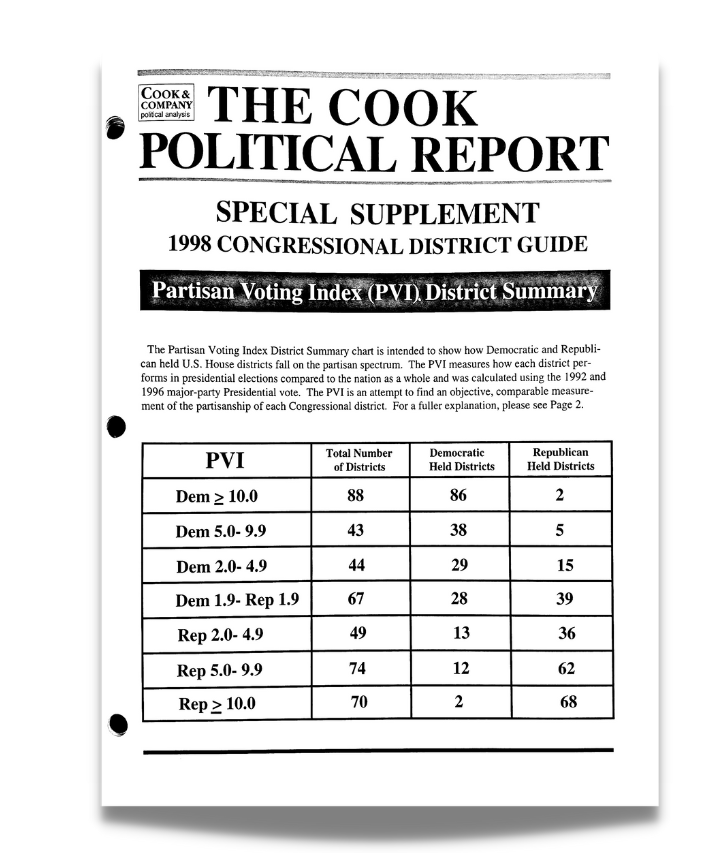
In August of 1997, The Cook Political Report introduced the Cook Partisan Voting Index (Cook PVI) as a means of providing a more accurate picture of the competitiveness of each of the 435 congressional districts. Whereas our race ratings reflect our outlook for which party will win the next election in each state and district, the Cook PVI takes a longer view and seeks to measure the underlying partisanship of each district relative to the nation as a whole.
We have released new PVI scores following every election and instance of redistricting since 1996, each time taking into account the prior two presidential elections. Prior to 2020, the Cook Political Report contracted with Clark Bensen's firm Polidata to calculate presidential results by congressional districts and PVI scores. In 2021, the Cook Political Report teamed up with Dave Leip's Atlas of U.S. Presidential Elections to calculate 2020's results by district.
This time, to calculate new PVI scores for all 435 newly drawn districts, we've used 2016 and 2020 election results by district publicly available via Dave's Redistricting App, a free online mapping tool originally developed by Dave Bradlee that allows any user to draw and evaluate district boundaries. The app uses precinct-level election data largely compiled by the Voting Election & Science Team (VEST), a consortium of academic researchers.
The Cook Partisan Voting Index is an attempt to find an objective measurement of each congressional district and state. While other data such as the results of senatorial, gubernatorial, congressional and other local races can help fine-tune the exact partisan tilt of a particular district, those kinds of results don’t allow a comparison of districts across state lines. Only presidential results allow for total comparability.
A Partisan Voting Index (PVI) score of D+2, for example, means that in the 2016 and 2020 presidential elections, the state or district performed about two points more Democratic in terms of two-party vote share than the nation did as a whole, while a score of R+4 means the state or district performed about four points more Republican. If a state or district performed within half a point of the nation in either direction, we assign it a score of EVEN.
To determine the "national value" for these latest Cook PVI scores, we've taken a weighted (75/25) average of the Democratic share of the two-party presidential vote in 2020 and 2016, which is roughly 51.98 percent. So, if Joe Biden and Hillary Clinton both carried 57% of the vote in a given district in 2016 and 2020 respectively, the district would have a PVI score of roughly D+5. If they only carried 48%, the district would have a PVI score of R+4.
COOK PVI℠ is a service mark of Invincible Summer Media, Inc.
Subscribe Today
Our subscribers have first access to individual race pages for each House, Senate and Governors race, which will include race ratings (each race is rated on a seven-point scale) and a narrative analysis pertaining to that race.