With Census 2020 well underway, it's just a matter of time before seats in the U.S. House are reapportioned. So it seems like a good time to look back at the impact of the post-2010 round of congressional redistricting.
We decided to look at the 43 states with more than one congressional district to see how often they've had competitive races during the past decade. We defined competitive contests as those rated Lean Democratic, Toss Up, or Lean Republican in the Cook Political Report's final pre-election assessments for 2012, 2014, 2016, 2018, as well as the most recent (mid-August) ratings for 2020. We also included any seats held by one party but rated as likely to flip to the other party.
We won't assess whether the seats in question actually flipped partisan control when voters went to the polls. As handicappers, we're more interested here in whether the maps eventually produced competitive races.
Several factors helped produce a relatively large number of competitive races in particular states:
- maps drawn by bipartisan commissions
- a state's generally swingy nature
- a mid-decade redistricting decreed by ballot measure or judges
- demographic and partisan shifts within a state's electorate
But that still left room for a number of states to exit the decade with few or no competitive races, thanks to carefully tailored maps.
Here's a rundown of what we found.
Commission states:
The most regularly competitive state in the nation? Connoisseurs of redistricting (and of House races) will likely guess it correctly: Iowa.
Iowa has the nation's only fully nonpartisan system of redistricting; career officials draw the state's maps using cut-and-dried parameters. As has been the case in previous decades, Iowa has seen a bevy of competitive races since 2012 — 13 in all, or an average of more than two per election cycle, for a state that has only four House seats. This decade, Iowa lived up to its reputation for swinginess; six of the 13 competitive seats were initially held by Democrats and seven by Republicans.
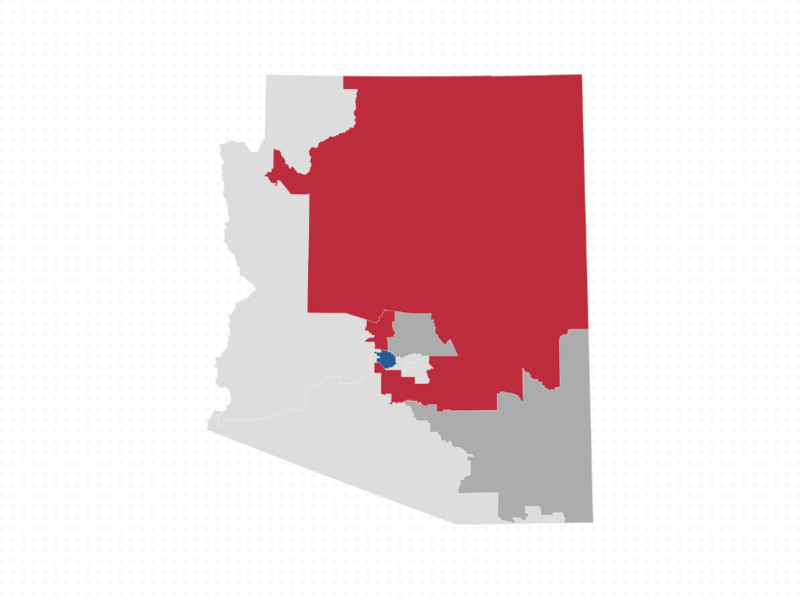
Several other states with bipartisan redistricting commissions ranked relatively high on the list. Arizona, a nine-seat state with 45 elections during the decade, had 11 competitive races, making it the seventh-most competitive per capita. Colorado, a seven-seat state with 35 elections, ranked 11th with six competitive races, and New Jersey, a 12-seat state with 60 elections, ranked 13th with 10 competitive contests.
California, which also uses a commission to draw its lines, ranked lower than these other commission states on a per-capita basis. However, it's worth noting that California had a much more competitive decade on the congressional front than it did during the previous decade, when maps were drawn by a traditional legislative method.
Following the 2000 Census, California's Democrats and Republicans collaborated on a status quo map that entrenched incumbents of both parties. And it worked: Over a decade, just a single seat changed partisan hands.
This decade, California has had 29 competitive races; in raw numbers, this was more than any state in the country. In 2012, California had an impressive eight competitive races, followed in subsequent cycles by six, six, six, and three competitive contests. The 29 competitive races involved seats held by a mix of both parties – 11 Democratic-held seats and 18 Republican-held seats.
There was only one multi-seat state where a commission drew the lines yet produced relatively few competitive races: Washington state, with just four competitive contests for its 10 U.S. House seats during the decade.
Swing states:
Another factor that produces competitive races is, not surprisingly, being a swing state.
Two small swing states ranked second and third for most competitive races per capita among multi-district states. New Hampshire, which has just two House seats, produced five competitive races during the decade; its 1st and 2nd districts were competitive, periodically flipping between the parties. And Nevada, with four seats, had eight competitive races, five in Democratic-held seats, and three in Republican-held seats.
Another relatively swingy state, eight-seat Minnesota, had 11 competitive races this decade, ranking fifth per capita.
In addition, a few small states produced a decent degree of competitiveness because they had one consistently fought-over district, namely Maine, Nebraska, and Utah.
Mid-decade redistricting:
Four states that had enacted Republican lines after the 2010 Census later conducted a mid-decade redistricting. In each case, the number of competitive seats spiked – and the Democratic Party, initially the minority party in the legislature, benefited.
Florida had six competitive races combined in 2012 and 2014, but after the passage of a ballot measure kicked off a new round of redistricting, the state played host to seven competitive races in each of 2016 and 2018.
In Virginia, a judicially ordered remap for 2016 produced more competitive races (though a political shift towards the Democrats in the state helped as well). In 2012 and 2014, under Republican-drawn maps, there was just one competitive race; in 2016, 2018, and 2020, under the new lines, there have been a combined eight.
Pennsylvania, meanwhile, had a total of four competitive races in the decade's first three election cycles, when it was operating under aggressive GOP lines. But in 2018, the state saw a bonanza of eight competitive seats after the Democratic-majority state supreme court overturned that map. In 2020, there are an additional four Pennsylvania races considered competitive.
And North Carolina, which had skated by with just one competitive race in 2014 and three in 2018 now has three more in 2020, following a judicially ordered redraw.
Maps overtaken by demographic and political shifts:
In several states, the 2010 maps weren't toppled by a judicial ruling but by changing political allegiances. This is an occupational hazard of redistricting: The data and voting patterns that inform line-drawing at the start of the decade can look different at the end of it.
Virginia fits this category well, given the sharp shifts away from the GOP in suburban areas near Washington, D.C., and Richmond. Of the nine competitive races in Virginia during the decade, the GOP has been on the defensive seven times, compared to just two times for the Democrats. (And both of the Democratic-held seats were ones the party flipped in 2018 and are now defending in 2020.)
A similar pattern held in Illinois. Even though Democrats drew the post-2010 map in Illinois, the state drifted even further away from the Republicans after the maps passed, especially in the suburbs of Chicago. Illinois produced only four Democratic-held competitive seats during the decade, far fewer than the 11 Republican-held seats that were competitive.
Ditto for the Republican-drawn map in Michigan. In 2012 and 2014, there were only two competitive races. But in 2016, 2018, and 2020, there have been nine, and the GOP has played defense in seven of those nine races.
In 2020, the big prize for Democrats is Texas. Despite having 36 total seats in the House, Texas produced a puny four competitive races during the first three election cycles of the decade, thanks largely to its Republican-drawn maps. But in 2018, the suburbs shifted away from the GOP and non-whites flexed their electoral muscle, producing four competitive races, all of them held by Republicans. Now, for 2020, the number of competitive GOP-held seats has risen again, to six.
The gerrymanders that stood the test of time:
This still leaves about a dozen states where the maps produced few or no competitive races during the decade — maps Machiavelli would have been proud of.
Two of them were drawn by Democrats: Massachusetts, with two competitive races during the decade, and Maryland, with just one.
More commonly, though, these states had Republican-drawn maps that held the Democrats at bay all decade.
Georgia, with 14 seats, had just six competitive races during the decade. Ohio, with 16 seats, had only five. Indiana, a nine-seat state, had four competitive races. Missouri and Wisconsin, each with eight seats, mustered just two competitive races each. And Tennessee, with nine seats, had just one.
And the reigning champions of post-2010 gerrymandering? Not counting the states with just one or two House seats, we found four that had played host to zero competitive House elections during the decade.
Three of these were in the Deep South, where Republicans drew the maps and where voting is highly polarized along racial lines: Alabama, Louisiana, and Mississippi. The fourth is a Democratic-run state, Oregon.
It is these states that partisan map-drawers are already scrutinizing for clues to building a lasting partisan advantage.


Subscribe Today
Our subscribers have first access to individual race pages for each House, Senate and Governors race, which will include race ratings (each race is rated on a seven-point scale) and a narrative analysis pertaining to that race.