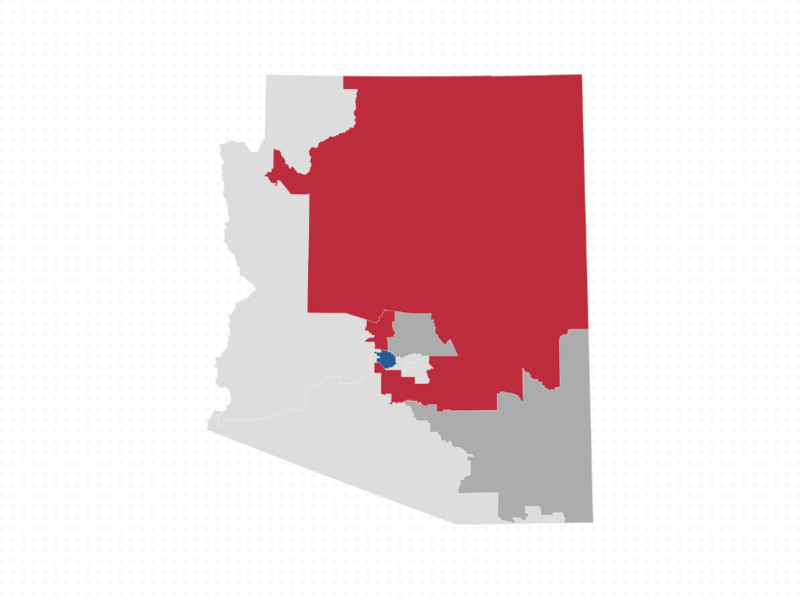
The classification of “Toss Up” is used to refer to those races which are the most competitive of the cycle, and which either party stands a reasonable chance of winning. Yet, if the results of Toss Up races taken together actually broke down like coin flips, we would expect to see parties walking away with roughly equal shares of these competitive seats each year. In reality, the closest races each election tend disproportionately toward one party.
In the chart below, we’ve listed each cycle’s Toss Up Senate races over the last twelve cycles and how their eventual outcomes broke down by party. The ratings are based on the last ratings published before Election Day.
Download the chart.


Subscribe Today
Our subscribers have first access to individual race pages for each House, Senate and Governors race, which will include race ratings (each race is rated on a seven-point scale) and a narrative analysis pertaining to that race.