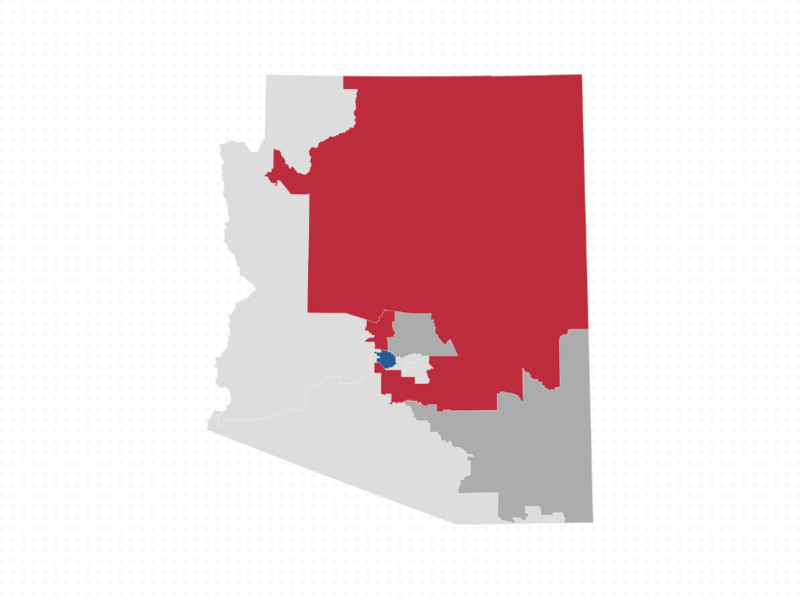
In August of 1997, The Cook Political Report introduced the Cook Partisan Voting Index (Cook PVI) to provide a more accurate picture of the competitiveness of each of the 435 congressional districts. With the 2022 PVI release, we made a slight change to how we calculate PVI scores: instead of using a 50/50 mix of the two most recent presidential elections to assess partisanship as we've done in the past, we're switching to a 75/25 weighting in favor of the more recent presidential election. Using the updated formula, we are re-releasing the PVI scores for every Congress since the 105th (1997).
Explore other years:
1997 (105th Congress) 1999 (106th Congress) 2001 (107th Congress) 2003 (108th Congress) 2005 (109th Congress) 2007 (110th Congress) 2009 (111th Congress) 2011 (112th Congress) 2012 (Post-Redistricting) 2013 (113th Congress) 2015 (114th Congress) 2017 (115th Congress) 2019 (116th Congress) 2021 (117th Congress) 2023 (118th Congress)Active CPR subscribers can request the Cook PVI data in spreadsheet format.
Sources:
Map shapefile: United States Census TIGER/Line® Shapefiles
Presidential election data: Before 2020, the Cook Political Report contracted


Subscribe Today
Our subscribers have first access to individual race pages for each House, Senate and Governors race, which will include race ratings (each race is rated on a seven-point scale) and a narrative analysis pertaining to that race.